
/ Interface Screenshots
The real interface. Unedited.
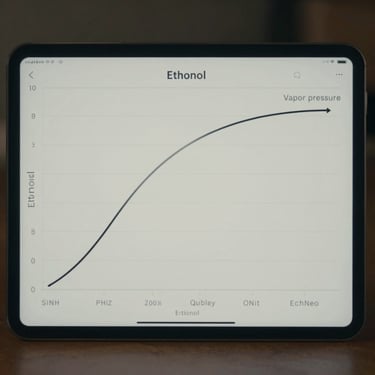
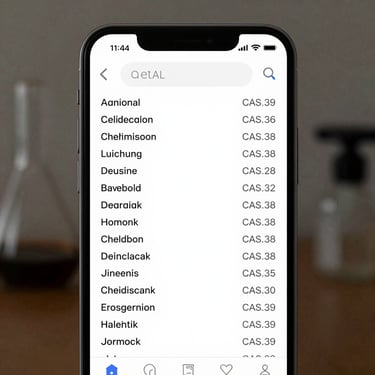
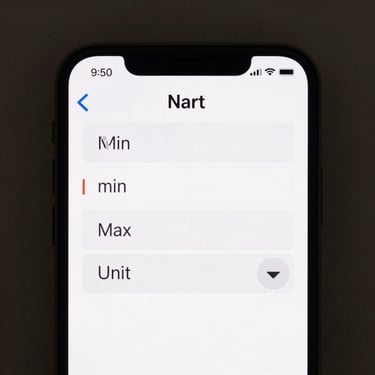
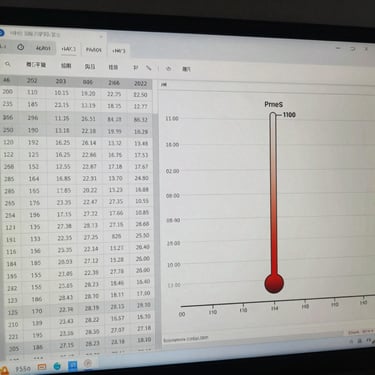
Every screenshot below is taken from the shipping build. Compound selector, temperature range, pressure plot, data table — exactly as it runs on your machine.
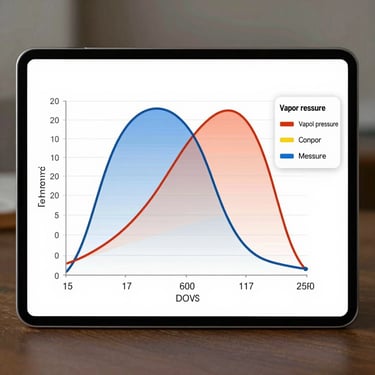
— Full application views
Plots, tables, and inputs
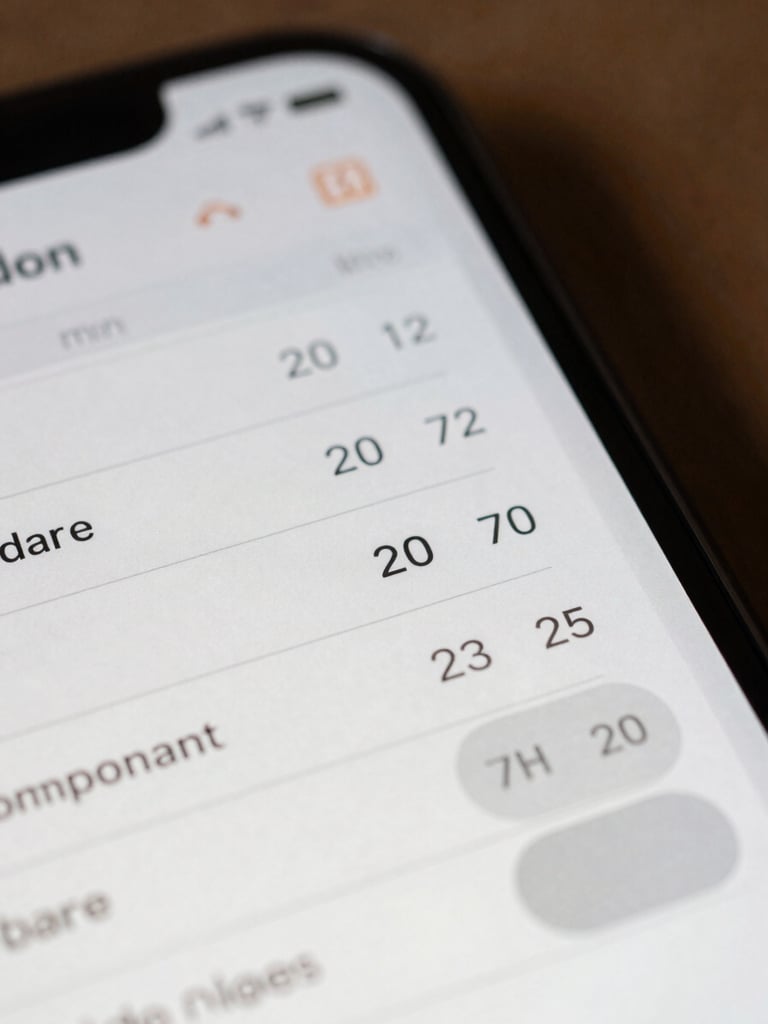
+ UI detail
Every control, plainly labeled
The compound selector queries by name or CAS number. Temperature range accepts Kelvin or Celsius. The output plot updates immediately — no recalculate button.
Data tables display alongside every plot. Values are compound-specific, drawn from peer-reviewed equation parameters — not interpolated from a generic curve.
Run it on your compounds.
Download VaporCalc, load your compounds, and check the output against your own references. No staged data, no demo mode.